24/7 Grafana Kiosk Display
24/7 Grafana Kiosk Display
As I was planning out my server rack setup, I knew I wanted a way to monitor my homelab metrics without constantly swapping between "nodes" on the "Node Exporter Full" dashboard template I had initally configured my Grafana instance with. I picked up a portable monitor and rigged up a c-clamp mount (designed for tablets) to hold it on the open-frame rack; specifically so I could have a live, always-on display of my Grafana dashboards. To make that work, I hooked up my Raspberry Pi 5's micro HDMI port and configured a it to run in kiosk mode 24/7. Ideally, this would be running on a dedicated SBC that does nothing but boot straight into a full-screen dashboard.
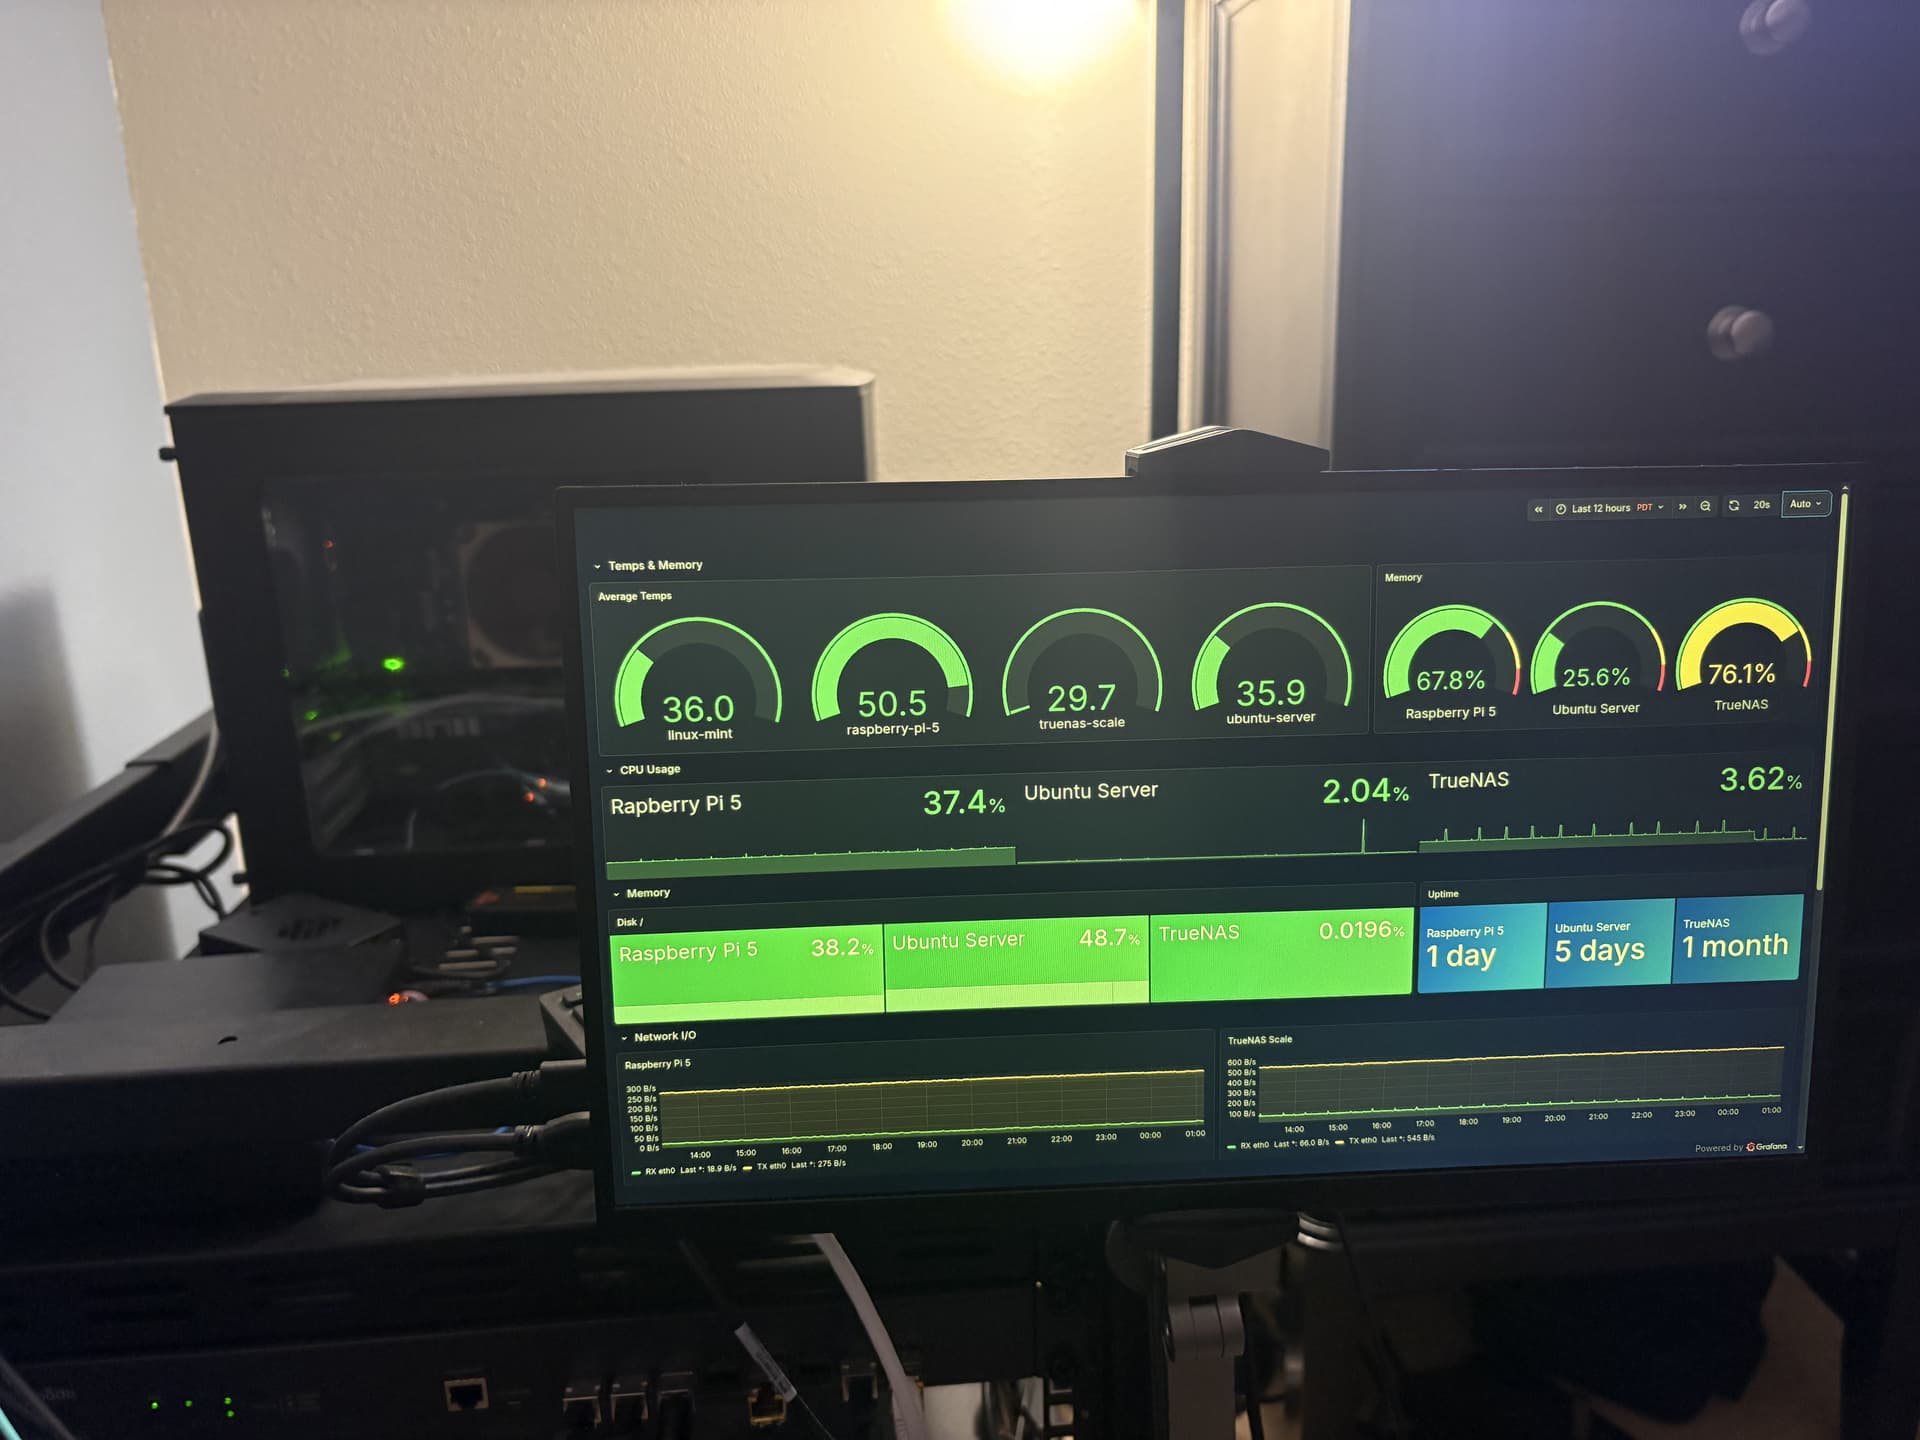
The Goal
The objective is a "simple and stable" kiosk: an automated setup that boots directly into a full-screen dashboard with minimal complexity. We want:
- An auto-login kiosk user on boot
- X server to start automatically without complex systemd service management for the X session itself
- A lightweight environment running Openbox and Chromium in kiosk mode
Architecture
Grafana (localhost:3000)
    ↓
Chromium (kiosk mode)
    ↓
X server + Openbox
    ↓
Monitor (HDMI/DP)
Prerequisites
You'll need:
- A Debian-based machine (or similar Linux distro)
- A monitor connected via HDMI or DisplayPort
- Grafana already installed and accessible locally
- SSH access with sudo privileges
Setup Process
1. Installing Minimal Dependencies
I wanted to keep this extremely lightweight. We only need the core components for the X server, a window manager, and the browser:
sudo apt update
sudo apt install -y xserver-xorg xinit openbox chromium unclutter
The unclutter package is great for keeping the display clean by hiding the mouse cursor when it's not in use.
2. Configuring Autologin
This is the most important step; configuring the system to automatically log in the kiosk user on tty1.
Use systemctl to edit the getty service for your first terminal:
sudo systemctl edit getty@tty1
Add the following configuration to ensure it logs in as the kiosk user without a password prompt:
[Service]
ExecStart=
ExecStart=-/sbin/agetty --autologin kiosk --noclear %I $TERM
3. Setting up the Launch Configuration (.xinitrc)
Now, we need to tell X what to run once it starts. Switch over to the kiosk user and create an .xinitrc file:
su - kiosk
nano ~/.xinitrc
Paste in this configuration, which handles power management, the window manager, and launches Chromium in the proper kiosk mode:
#!/bin/sh

# Disable power saving and screensavers
xset -dpms
xset s off
xset s noblank

# Hide the cursor
unclutter &

# Start the window manager
openbox &

# A small delay to ensure everything is stable before launching the browser
sleep 2

# Launch Chromium in kiosk mode
chromium \
  --noerrdialogs \
  --disable-infobars \
  --disable-session-crashed-bubble \
  --disable-translate \
  --kiosk \
  --incognito \
  "http://127.0.0.1:3000/d/YOUR_DASHBOARD_UID?orgId=1&refresh=30s&kiosk"
Make the script executable:
chmod +x ~/.xinitrc
4. Automating X on Login
Finally, we need to tell the kiosk user to start X automatically as soon as they log in via tty1. Edit the .bash_profile:
nano ~/.bash_profile
Add this logic to trigger startx only when logging into the first terminal:
if [ -z "$DISPLAY" ] && [ "$(tty)" = "/dev/tty1" ]; then
  startx
fi
5. Testing the Setup
Reboot the host:
sudo reboot
If everything is configured correctly, the system should boot, log in automatically, launch X, and present your Grafana dashboard in full-screen mode within seconds.
The Chromium Memory Problem
After running for a few days, I discovered Chromium's RAM usage grows more and more over time. Without intervention, the kiosk will eventually exhaust all available memory and either crash or become sluggish.
Currenly, I've added a system-level reboot via crontab:
sudo crontab -e
0 3 * * * /sbin/reboot
This reboots the entire machine every day at 3 AM.
Conclusion
I now have a live view of my homelab metrics without any additional effort. The machine boots, Chromium launches, and my dashboard is there waiting. Combined with the server rack setup, it's actually useful for spotting issues at a glance.
The whole stack is minimal enough that it'll run on basically any old hardware you have lying around.